Candlestick Cluster Analysis Explained

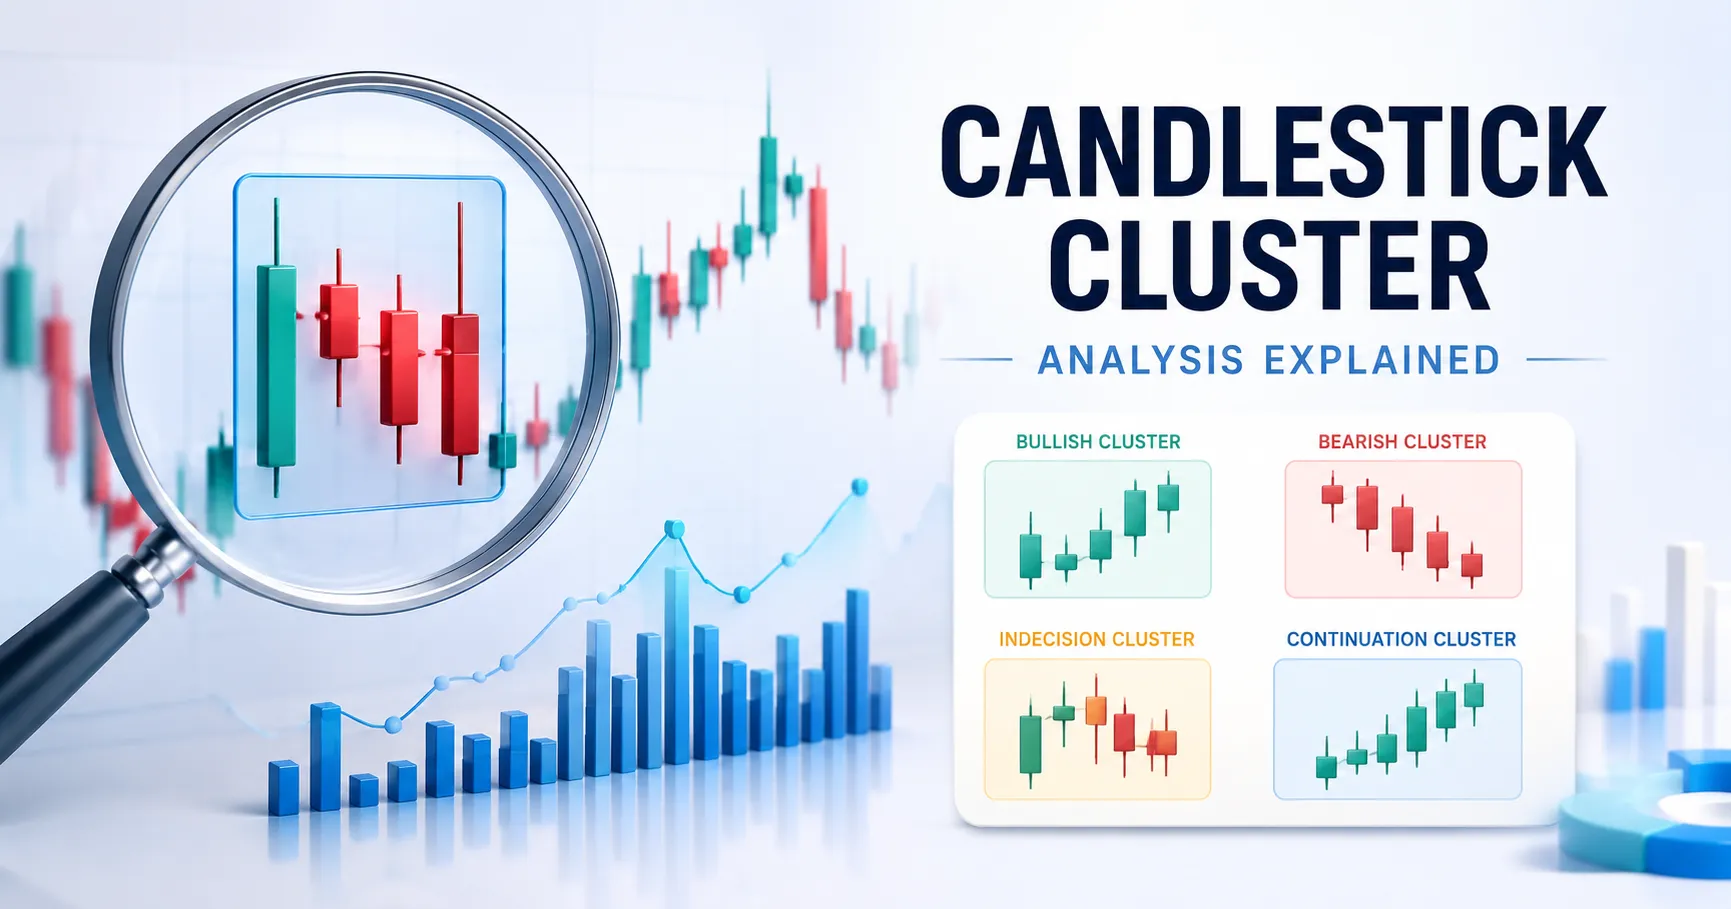
- Candlestick cluster analysis comes in two main forms: volume/footprint clustering and pattern-grouping clustering
- Footprint (volume cluster) charts break down each candle's volume by individual price level, showing exactly where buy and sell trades concentrated during that candle's formation
- A single footprint cluster typically shows two numbers, the sell volume and the buy volume executed at that specific price within the candle
- Pattern clustering involves identifying when specific candlestick formations (such as Bullish Engulfing patterns) concentrate within limited timeframes, which can signal heightened significance or caution for that period
- Academic research has applied unsupervised machine learning techniques, including k-means clustering, to classify candlesticks into groups based on the relative position of their open, high, low and close, then study what tends to follow each cluster type
- Footprint cluster analysis is most commonly used to identify key support and resistance levels where the market is likely to react, based on observed historical trading activity at that price
- Both clustering approaches work best when combined with broader risk management and other confirming technical analysis tools, rather than as a standalone trading signal
Candlestick cluster analysis groups candlesticks by shared attributes, such as price levels, time, or shape, to reveal patterns and trading levels that single-candle analysis misses. The term covers two related but distinct techniques: volume-based clustering (footprint charts that group trades by price and time within each candle to reveal where buying and selling pressure concentrated) and pattern-based clustering (grouping multiple candlestick formations to identify whether certain patterns concentrate in specific periods or precede specific outcomes). This guide explains both approaches, how they differ, and how traders apply each in practice.
Two Distinct Meanings of “Candlestick Cluster Analysis”
The term “cluster analysis” in candlestick trading context refers to two genuinely different techniques that happen to share terminology.
Volume/footprint clustering examines the internal structure of price action within a single candle, breaking down exactly how much buying and selling volume occurred at each individual price level as that candle formed. This is a microstructure-level technique focused on order flow.
Pattern-grouping clustering examines a broader set of candlesticks across a chart’s history, grouping similar formations together to study whether certain shapes or sequences tend to concentrate in specific periods or predict specific subsequent outcomes. This is a higher-level technique focused on classifying entire candle shapes rather than the volume within them.
Volume/Footprint Clustering Explained
Footprint cluster analysis takes each individual candlestick and breaks it down into clusters based on price level and time, rather than viewing the candle as a single block representing only open, high, low and close.
A footprint (cluster) chart displays the market broken down by the actual volume traded at each specific price level while that candle was forming. Each cluster typically shows two numbers: the volume of sell trades executed at that price, and the volume of buy trades executed at that same price.
This level of granularity allows traders to identify exactly where significant buying or selling pressure concentrated within a given price range, rather than only seeing the candle’s overall net result.
| Chart Type | What It Shows | Best For |
|---|---|---|
| Standard candlestick | Open, high, low, close for the period | General trend and pattern recognition |
| Footprint/cluster chart | Buy and sell volume at each individual price level within the period | Identifying precise support/resistance and order flow imbalances |
Practical application of footprint clusters: Traders often look for a sharp imbalance between buy and sell volume at a particular price (a “stacked imbalance”), which can indicate unusually aggressive one-sided activity at that level.
Pattern-Grouping Clustering Explained
The second form of candlestick cluster analysis groups multiple candlestick formations together, either through manual visual classification or more systematic statistical methods.
Visual clustering for pattern frequency. One straightforward application involves plotting where specific candlestick patterns occur across a price history, then visually checking whether those patterns cluster within limited timeframes.
Statistical clustering using machine learning. A more rigorous approach applies unsupervised machine learning techniques, most commonly k-means clustering, to classify candlesticks based on the relative position of their open, high, low and close values. Researchers using this approach have studied whether statistically significant patterns exist in certain clusters following others, and what the distribution of subsequent returns looks like.
This statistical approach offers an advantage over relying solely on named, traditional candlestick patterns: it can reveal groupings and relationships in the data that do not correspond to any pre-existing, human-labeled pattern.
How Pattern Clustering Connects to Traditional Candlestick Patterns
Traditional candlestick analysis already relies heavily on grouping multiple candles together to interpret a “story” about market sentiment, rather than reading any single candle in isolation. Patterns such as the Concealing Baby Swallow or the Island Reversal are themselves a form of manual candlestick clustering, where the meaningful signal comes from the relationship between several specific candles rather than any one candle alone.
Limitations of Candlestick Cluster Analysis
Candlestick patterns describe the past, not the future. Whether examining footprint clusters or pattern groupings, all of this analysis is built from historical price and volume data.
Pattern clustering can produce false signals in volatile or ranging markets. Both individual candlestick patterns and broader pattern clusters tend to become less reliable during choppy, directionless conditions.
Footprint analysis on very short timeframes carries particular risk. Literature on candlestick analysis broadly cautions that pattern-based forecasting becomes less reliable on timeframes below the 1-hour chart.
Statistical clustering requires careful interpretation. Machine learning-based clustering approaches require enough historical instances of each cluster type to draw statistically meaningful conclusions, or the result risks overfitting to noise.
Who Should Use Which Approach?
| Trader Profile | Most Relevant Approach |
|---|---|
| Scalpers and order-flow traders | Footprint/volume clustering, for precise support/resistance and imbalance detection |
| Swing traders using traditional patterns | Manual multi-candle pattern recognition (a simpler form of clustering) |
| Quantitative/systematic traders | Statistical clustering (k-means or similar) for backtestable, data-driven pattern classification |
| Beginner discretionary traders | Start with higher timeframe (1H+) traditional pattern recognition before attempting footprint analysis |
Our Take
Candlestick cluster analysis is not a single technique but a family of related approaches united by the same underlying idea: grouping price and volume information together reveals structure that examining isolated, individual candles cannot. Footprint or volume clustering operates at the microstructure level, revealing exactly where buying and selling pressure concentrated within a candle’s formation, while pattern-grouping clustering operates at a higher level, studying how multiple candlestick shapes relate to each other and to subsequent price behavior, whether through traditional named patterns or statistical methods like k-means clustering.
Both approaches share the same fundamental limitation: they describe historical price and volume behavior, and while that description can be detailed and statistically grounded, it does not guarantee future outcomes. Combining either clustering method with sound risk management and additional confirming analysis remains essential regardless of which specific technique a trader applies.
This article is for informational and educational purposes only and does not constitute financial or trading advice. Trading carries risk of loss, and no technical analysis method guarantees profitable outcomes. Always conduct your own research before applying any strategy with real capital.
Frequently Asked Questions
