How to Read Forex Charts: A Beginner’s Complete Guide

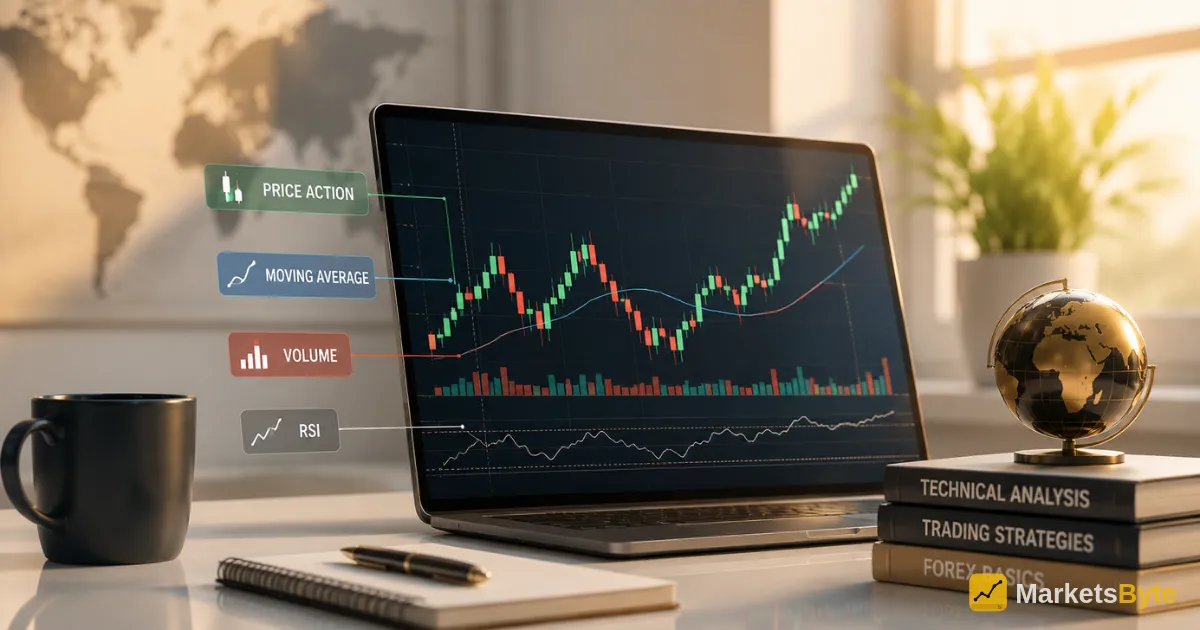
- A forex chart plots price, the vertical axis, against time, the horizontal axis, with currency pairs shown relative to a chosen timeframe ranging from minutes to months
- Line charts connect closing prices only and are the simplest format, while bar and candlestick charts both display the open, high, low, and close, or OHLC, for each period
- Candlesticks are the most widely used chart type because they convey the same OHLC data as bar charts but in a more visually intuitive, color-coded format
- A green or white candlestick means the closing price was higher than the opening price, bullish; a red or black candlestick means the opposite, bearish
- The candlestick's wicks, sometimes called shadows, show the highest and lowest prices reached during the period, while the body shows the range between open and close
- Candlestick patterns are generally considered more reliable on the 1-hour timeframe or higher, since shorter timeframes introduce more noise relative to genuine signal
- No chart pattern guarantees future price movement; candlestick reading should be combined with risk management, support and resistance analysis, and ideally additional confirming indicators rather than used in isolation
Reading a forex chart comes down to understanding three core chart types, line, bar, and candlestick, and recognizing that candlesticks, the most popular and detailed format, reveal the open, high, low, and close price for any given period through color, body, and wick. Once you understand how a single candlestick is constructed, the same logic scales up to multi-candle patterns that reveal market sentiment and potential turning points. This guide walks through chart anatomy, candlestick construction, key patterns, and how to combine chart reading with sound risk management rather than treating it as a standalone crystal ball.
The Three Main Forex Chart Types
Every forex chart plots the same underlying data, price against time, but the three common chart formats display that data with varying levels of detail.
Line charts connect a series of closing prices with a simple, continuous line, showing the broad direction of price movement over a selected period. They are the simplest chart type, but they hide significant detail.
Bar charts, also called OHLC charts, display the open, high, low, and close for each period using a vertical line with two small horizontal notches. This format conveys the same core information as a candlestick chart but in a less visually intuitive way.
Candlestick charts display the identical open, high, low, and close data as bar charts, but use a color-coded body and wick structure that makes bullish or bearish sentiment instantly recognizable at a glance. This combination is why candlesticks have become the dominant chart type among forex traders.
| Chart Type | Data Shown | Best For |
|---|---|---|
| Line chart | Closing price only | Quick overview of broad trend direction |
| Bar (OHLC) chart | Open, high, low, close | Traders who prefer a less color-dependent format |
| Candlestick chart | Open, high, low, close | Most traders; fastest visual read of sentiment and price action |
Anatomy of a Single Candlestick
Understanding how one candlestick is constructed is the essential foundation for everything else in candlestick analysis. Each candlestick is built from three distinct visual elements: color, body, and wicks.
Color indicates whether the period was bullish or bearish. A green, or white, candlestick means the closing price was higher than the opening price. A red, or black, candlestick means the closing price was lower than the opening price.
The real body is the thick, rectangular portion of the candlestick, representing the range between the opening and closing prices.
The wicks, also called shadows, are the thin lines extending above and below the body. The upper wick shows the highest price reached during the period, while the lower wick shows the lowest price reached.
A candlestick with a long upper wick but a small body tells a specific story: price rallied significantly during the session but was then pulled back down close to its opening level by the close, suggesting that buying pressure ultimately failed to hold.
Reading What a Candlestick Tells You About Market Psychology
Candlesticks are popular specifically because they convey market sentiment, not just raw price levels. A candlestick with a large body and minimal wicks suggests strong, decisive conviction in one direction. A candlestick with a small body and long wicks on both sides, known as a doji, indicates genuine indecision: price moved significantly in both directions but ultimately closed very near where it opened.
Key Candlestick Patterns Worth Knowing
Doji candlesticks have very short bodies and longer wicks, signaling high volatility within the session but an ultimate return close to the opening price.
Hammer patterns show a small body near the top of the candle with a long lower wick, suggesting that sellers pushed price down significantly during the session, but buyers stepped in forcefully enough to push price back up near the open by the close.
Engulfing patterns involve two consecutive candles, where the second candle’s body completely “engulfs” the body of the first.
Head and shoulders is a broader, multi-candle chart pattern signaling a potential trend reversal, formed by three peaks where the middle peak is higher than the two surrounding peaks.
Triangles, both ascending and descending, suggest a period of consolidation that often precedes either a continuation of the existing trend or a breakout in a new direction.
| Pattern | What It Signals |
|---|---|
| Doji | Market indecision; potential turning point |
| Hammer | Potential bullish reversal, especially at support |
| Bullish/bearish engulfing | Potential shift in momentum direction |
| Head and shoulders | Potential trend reversal |
| Triangles (ascending/descending) | Consolidation suggesting continuation or breakout |
Why Timeframe Choice Changes What You See
The same candlestick pattern can carry very different meaning depending on which timeframe you are viewing. A pattern that appears clean and significant on a 5-minute chart may be statistical noise when viewed in the context of the daily chart, and vice versa.
Candlestick patterns are generally considered more reliable on timeframes of 1 hour or higher, since shorter timeframes introduce considerably more noise relative to genuine signal. This does not mean shorter timeframes are useless; scalpers and very short-term traders rely on them constantly.
Combining Chart Reading with Indicators and Support/Resistance
Support and resistance levels add crucial context to any candlestick pattern. A hammer pattern forming at a level where price has previously bounced multiple times carries considerably more weight than the identical hammer forming in an otherwise empty price range.
Moving averages, RSI, and MACD are commonly layered on top of candlestick charts to add confirmation. Volume, where available, helps verify whether a candlestick pattern is backed by genuine participation.
Common Mistakes Beginners Make Reading Charts
Trading against the dominant trend. Identifying trend direction should always come before looking for specific candlestick signals.
Overloading the chart with indicators. A clean chart with one or two carefully chosen confirming tools is generally more useful than a screen crowded with a dozen different overlays.
Treating single candles as standalone, definitive signals. Combinations of candles, and the broader context of trend, support and resistance, and timeframe, are considerably more powerful than any one candle examined in isolation.
Ignoring the timeframe mismatch problem. A signal that looks compelling on a very short timeframe may simply not carry the same weight on a higher timeframe.
Who Should Focus on Chart Reading Skills?
| Trader Profile | Relevance of Strong Chart-Reading Skills |
|---|---|
| Complete beginners | Foundational skill required before any technical strategy can be applied effectively |
| Price-action-only traders | Very high; candlestick reading is the core, often sole, analytical tool used |
| Indicator-heavy systematic traders | Moderate; charts still provide essential visual context alongside indicator signals |
| Long-term fundamental investors | Lower priority, though basic chart literacy remains useful for entry/exit timing |
Our Take
Learning to read forex charts begins with understanding the three core chart formats and recognizing why candlesticks have become the dominant choice: they convey the full open, high, low, and close data of a bar chart while adding an immediately readable visual signal of market sentiment through color, body, and wick structure. From there, recognizing key single-candle and multi-candle patterns, and understanding how timeframe choice affects their reliability, builds the foundation needed to interpret price action with genuine confidence.
The most important caveat throughout is that chart reading, however skilled, remains probabilistic rather than predictive. Combining candlestick analysis with support and resistance context, sensible timeframe selection, and disciplined risk management consistently produces more reliable trading decisions than treating any single pattern as a guaranteed signal on its own.
This article is for informational and educational purposes only and does not constitute financial or trading advice. Forex trading carries significant risk of loss. Always conduct your own research and consult a qualified financial advisor before making trading decisions.
Frequently Asked Questions
