Order Flow Basics for New Traders

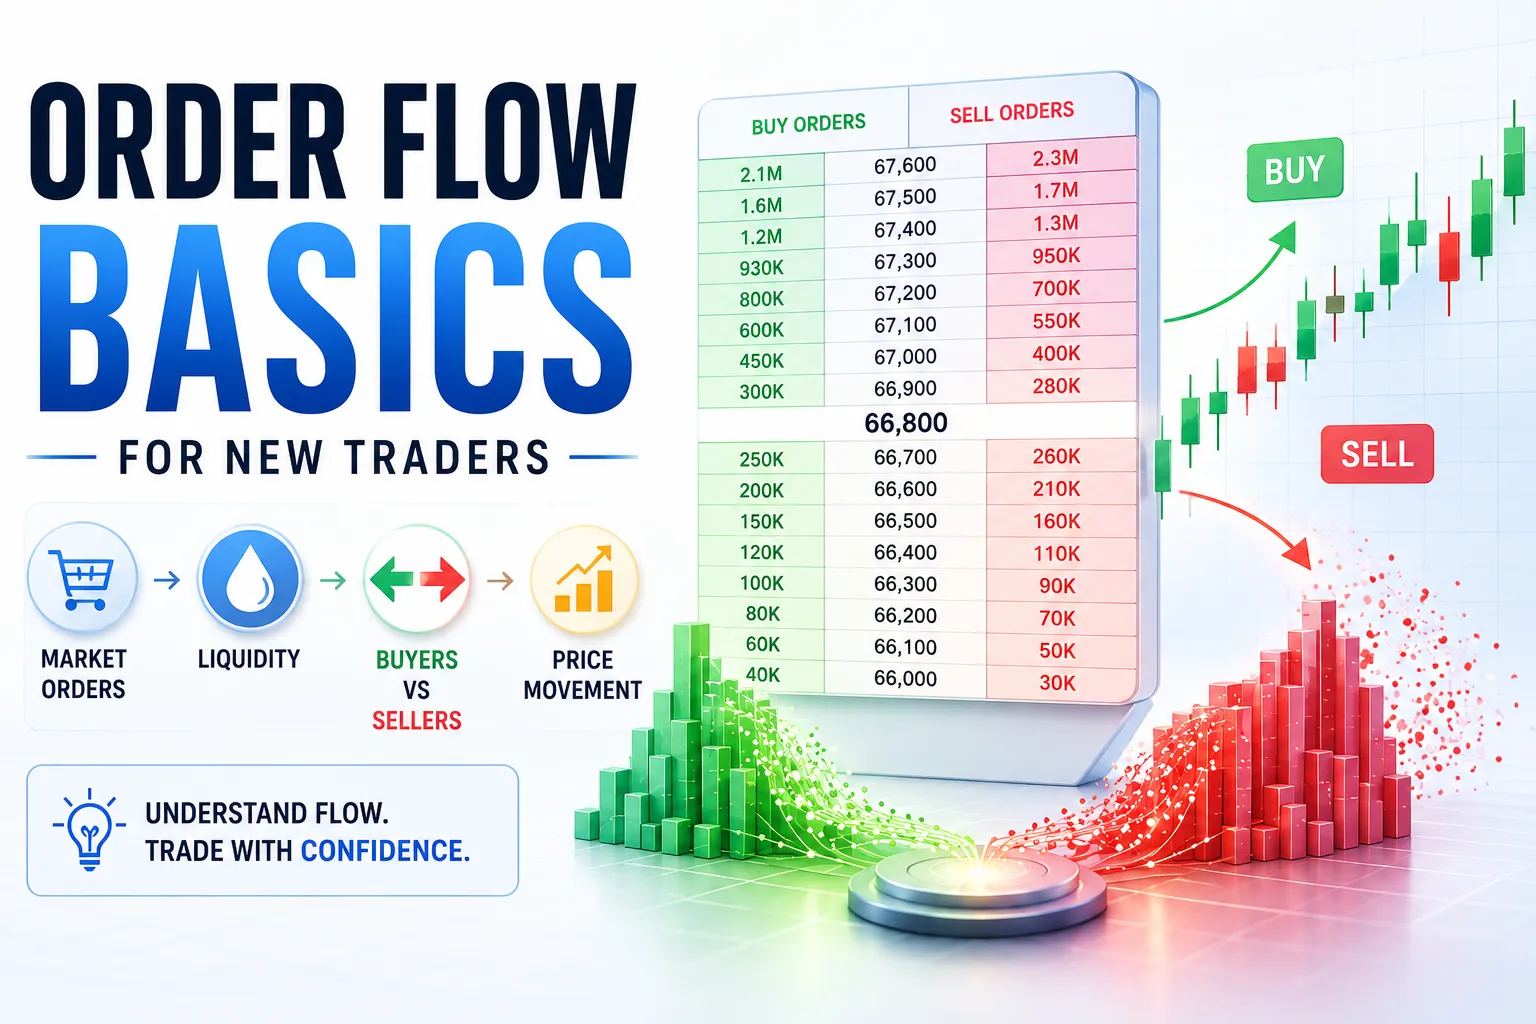
- Order flow = live stream of buy/sell orders; reveals market intent behind price action
- Price is a result of order flow, not the cause
- Key tools: order book (depth), time and sales (tape), footprint chart, delta, volume profile
- Aggressive orders (market orders) move price; passive orders (limit orders) absorb it
- Imbalance between aggression and absorption = directional move
- Volume Profile shows where most trading happened = key price levels
- Delta = net difference between aggressive buying and selling within a candle
- Order flow works best on liquid instruments: major forex pairs, BTC, ES futures, NQ
- NOT a standalone system; combine with structure, levels, and context
Order flow is the real-time stream of buy and sell orders hitting the market. Price moves because of imbalances in this flow: more aggressive buyers than sellers = price up; more aggressive sellers than buyers = price down. Reading order flow means reading who is doing what, right now, not what price did in the past.
Why Price Moves: The Core Mechanic
Most traders learn price action after the fact. Order flow shows it before the candle closes.
Two order types drive everything:
Market orders = aggressive. Buyer or seller says “fill me now at whatever price.” These consume resting liquidity and move price immediately.
Limit orders = passive. Buyer or seller says “fill me only at this price.” These sit in the order book and absorb incoming market orders.
Price moves when aggressive orders overwhelm the passive ones. If 500 contracts of aggressive buy orders hit, but only 300 resting sell orders exist at that price, price has to move up to find more sellers.
That imbalance is order flow.
The Four Core Tools
1. Order Book (Level 2 / Depth of Market)
Shows resting limit orders at every price level, both bids (buyers) and asks (sellers). Large resting orders = potential support or resistance. Thin book = price can move quickly through that level.
Warning: large visible orders can be spoofed. Do not treat every large order as guaranteed support.
2. Time and Sales (The Tape)
Live feed of every executed trade: price, size, direction, timestamp. Tape moving fast with large prints on the bid = aggressive selling. Large prints lifting the ask repeatedly = aggressive buying.
3. Footprint Chart
Candlestick with buy/sell volume at each price level printed inside the bar. Each cell shows two numbers: sell volume on left, buy volume on right.
Imbalance = when buy volume dramatically exceeds sell volume at a price level (or vice versa). Stacked imbalances across multiple levels = strong institutional interest.
4. Volume Profile
Total volume traded at each price level over a selected period, displayed as a horizontal histogram.
- POC (Point of Control): price level with most volume = strongest magnet for price
- HVN (High Volume Node): heavy trading area = price slows and consolidates here
- LVN (Low Volume Node): thin trading area = price moves through quickly
| Tool | What It Shows | Best For |
|---|---|---|
| Order book | Resting limit orders by price level | Identifying absorption zones |
| Time and sales | Every executed trade in real time | Reading aggression and momentum |
| Footprint chart | Buy/sell volume inside each candle | Spotting imbalances and absorption |
| Volume profile | Volume distribution by price level | Finding key reference levels (POC, HVN, LVN) |
Delta: The Core Order Flow Metric
Delta = aggressive buy volume minus aggressive sell volume within a candle or session.
- Positive delta = more aggressive buying than selling
- Negative delta = more aggressive selling than buying
Divergence is where it gets interesting. Price makes a new high but delta falls or turns negative = buyers losing conviction. That divergence often precedes reversals.
Cumulative delta tracks the running total across an entire session, revealing whether buyers or sellers are winning the day.
Absorption vs. Initiation
Absorption: Passive limit orders absorb incoming aggressive orders without price moving. Large sell limit order at 100.00 absorbs 500 buy market orders, price stays at 100.00. That level is being defended.
Initiation: Aggressive orders overwhelm passive ones, price moves. The level breaks.
Reading whether a level absorbs or initiates is the core skill in order flow trading. A level that absorbs heavy aggressive buying without breaking = strong resistance. A level that fails to absorb = breakout with conviction.
Common Order Flow Setups
Failed Auction: Price moves to a level, aggressive volume hits, price cannot sustain or extend. Market fails to find new participants, snaps back. The failed move creates the signal.
Exhaustion: Heavy aggressive buying into resistance, delta spikes, then momentum dies. Sellers absorb everything. Common near tops of intraday moves.
Absorption at key level: Price approaches high-volume support. Tape shows large sell orders getting hit but price not moving. Sellers absorbing buyers = reversal likely.
Breakout with volume confirmation: Price breaks a key level, aggressive volume spikes, delta aligns, tape confirms initiative buying. Higher probability continuation than a low-volume breakout.
What Markets Work Best
Best for order flow:
- CME futures (ES, NQ, CL, GC): centralized exchange, real order book, real tape
- BTC and ETH spot/perps on major exchanges: deep enough liquidity for reliable signals
- Major forex pairs via ECN brokers: aggregated depth, usable but less transparent than futures
Avoid:
- Thin altcoins: easily spoofed, low participation
- CFDs via market-maker brokers: synthetic prices, no real order book
Order Flow vs. Price Action
| Factor | Price Action | Order Flow |
|---|---|---|
| Data source | Historical OHLC | Live trade execution data |
| Lag | Lagging (candle must close) | Real-time (sub-second) |
| Signal type | Pattern-based, probabilistic | Participation-based, contextual |
| Learning curve | Moderate | Steep (tape/footprint take time) |
| Works best with | Structure, support/resistance | Structure, support/resistance (same) |
Limitations to Know Early
Spoofing: Large visible orders can be pulled before execution. Never assume a large order means a guaranteed level.
HFT interference: Algorithms react in microseconds, creating short-lived signals not tradeable at human speed.
Subjectivity: Two traders reading the same tape can reach different conclusions. Order flow requires experience and market-specific calibration, not just learning the concept.
Replay is mandatory: Practical tape-reading skill requires hundreds of hours of live or replay data. Pattern recognition builds through repetition, not formula.
Starter Workflow for New Traders
Step 1: Learn volume profile first. Mark POC, HVNs, LVNs before the session. These are reference levels.
Step 2: Add footprint chart on primary timeframe. Watch volume distribution inside candles at key levels.
Step 3: Check delta at those levels. Is aggressive buying or selling dominating?
Step 4: Add time and sales last. Tape is hardest; build it on top of everything else.
Step 5: Practice on replay before real capital. Bookmap, Sierra Chart, Jigsaw, NinjaTrader all offer replay.
Who Should Study Order Flow
| Trader Profile | Fit |
|---|---|
| Day traders and scalpers on liquid markets | Very high. Core tool for short-term execution |
| Swing traders | Moderate. Volume profile highly useful; live tape less relevant |
| Crypto perpetual futures traders | High. Delta, footprint, and liquidation data all applicable |
| Long-term investors | Low. Macro timeframe makes order flow noise rather than signal |
Our Take
Order flow is not a strategy. It is market context, the real-time evidence of who is doing what and with what conviction. Price action tells you what happened. Order flow tells you why, and sometimes what is about to happen before the candle closes.
For new traders, the right entry point is volume profile first, then footprint and delta, then tape reading, in order of increasing difficulty. Each layer adds precision to existing structure-based analysis rather than replacing it.
This article is for informational and educational purposes only and does not constitute financial or trading advice. Trading carries significant risk of loss. Always conduct your own research before trading with real capital.
Frequently Asked Questions
