BTC Dominance Rotation Signals Explained

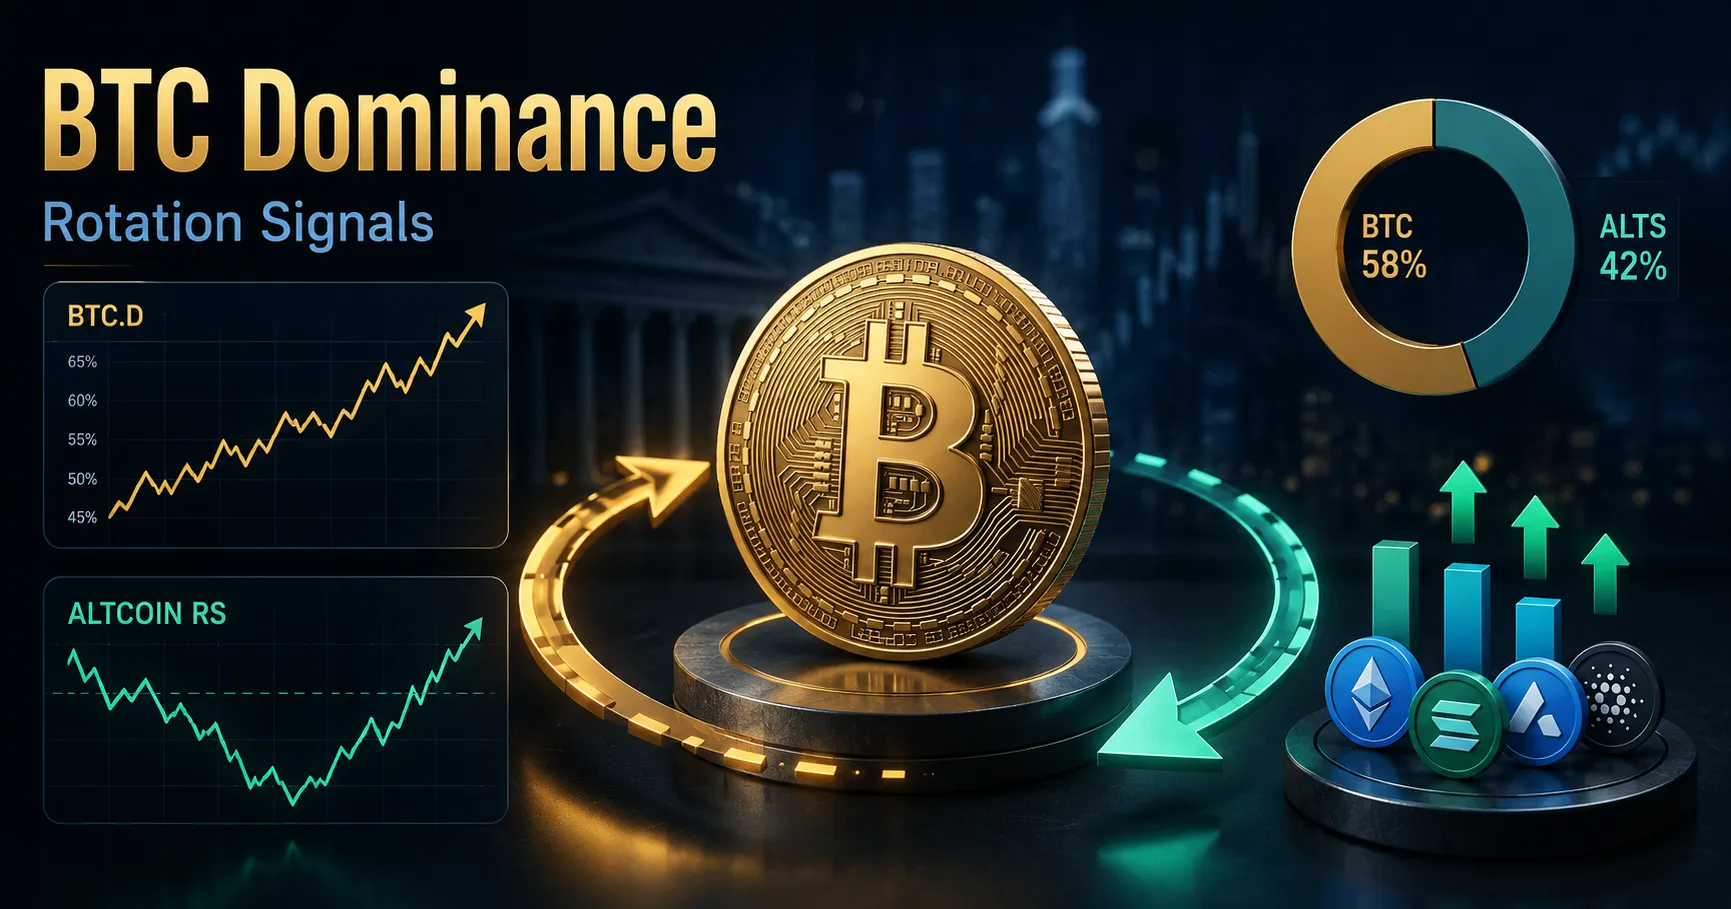
- Bitcoin dominance is calculated as Bitcoin's market capitalization divided by the total cryptocurrency market capitalization, expressed as a percentage
- A rising BTC.D generally pressures altcoins, while a falling BTC.D can signal the start of altcoin rotation, but only if total crypto market cap is also growing at the same time
- As of June 2026, BTC.D stands at roughly 56-58%, down from a 65% peak in June 2025, while the Altcoin Season Index remains around 46-49, still within "Bitcoin Season" territory (below the 75 threshold for confirmed altseason)
- Historical altseason triggers occurred at much lower dominance levels: around 38% BTC.D in January 2018, and below 45% in 2021, suggesting the trigger threshold may need to be recalibrated upward for the ETF-driven 2026 market structure
- Raw BTC.D calculations include stablecoins (over $300 billion in market cap as of recent data) in the denominator, which can distort the reading by 6-8 percentage points compared with a stablecoin-adjusted figure
- Spot Bitcoin ETFs have attracted tens of billions in cumulative net inflows since their January 2024 launch, capital that enters exclusively through Bitcoin and does not rotate into altcoins, structurally keeping dominance higher than in prior cycles
- A sustained break below approximately 55% BTC.D is widely cited as the level needed before a broad altcoin rotation can be considered confirmed in the current cycle
BTC dominance (BTC.D) measures Bitcoin’s share of the total cryptocurrency market capitalization, and tracking its movement helps traders identify capital rotation between Bitcoin and altcoins. As of June 2026, Bitcoin dominance sits at approximately 56-58%, down from a June 2025 peak of 65%, yet the Altcoin Season Index remains in “Bitcoin Season” territory, illustrating a key lesson: a falling BTC.D alone does not confirm an altcoin rotation is underway. This guide explains how to read dominance correctly, the specific thresholds traders watch, and the structural factors distorting the signal in the current cycle.
How Bitcoin Dominance Is Calculated and What It Actually Measures
Bitcoin dominance is calculated by dividing Bitcoin’s market capitalization by the total market capitalization of all cryptocurrencies combined, then expressing the result as a percentage. If the total crypto market is worth $3 trillion and Bitcoin’s market cap is $1.5 trillion, Bitcoin dominance is 50%.
It is critical to understand what this number is, and is not, measuring. BTC.D is a ratio describing relative performance, not an absolute price indicator. If Bitcoin’s price rises 5% while altcoins stay flat, dominance rises, even though Bitcoin’s price went up. If both Bitcoin and altcoins fall, but altcoins fall harder, dominance also rises, even though Bitcoin itself lost value.
The Two Core Scenarios Dominance Describes
Rising dominance typically occurs when uncertainty spikes, driven by macro fears, regulatory crackdowns, or a broader bear market. Capital retreats toward Bitcoin specifically because it is the largest, most liquid crypto asset. During these phases, altcoins can lose 30-50% of their value against Bitcoin even while Bitcoin’s own dollar price remains flat or rises.
Falling dominance typically occurs once Bitcoin has established a strong uptrend and confident traders begin rotating realized profits into Ethereum and other altcoins in search of higher returns. This is the scenario most associated with “altseason.”
The critical condition often overlooked: a falling BTC.D only signals genuine altcoin rotation if total crypto market cap is simultaneously growing. If BTC.D is falling because the entire market is shrinking and altcoins are simply losing value more slowly than Bitcoin, that is a fundamentally different, and less bullish, scenario.
Current Dominance Levels and the Altcoin Season Index (June 2026)
As of June 2026, Bitcoin dominance stands at approximately 56-58%, depending on the data source and whether stablecoins are included in the calculation. This represents a meaningful decline from the June 2025 peak of 65%, but remains well above the levels that have historically marked the start of a confirmed altcoin season.
The Altcoin Season Index, which tracks the percentage of top altcoins outperforming Bitcoin over a 90-day window, has been reading in the 46-49 range through May and June 2026. This is firmly within “Bitcoin Season” territory, since the index requires a reading of 75 or higher to confirm a broad-based altcoin season is underway. Notably, this represents an increase from lower readings of roughly 30-37 seen in April and May 2026, suggesting gradual, but not yet confirmed, rotation momentum building.
| Metric | June 2026 Reading | Historical Context |
|---|---|---|
| BTC Dominance (BTC.D) | ~56-58% | Down from 65% peak (June 2025) |
| Altcoin Season Index | ~46-49 | Up from 30-37 in April/May 2026; still below 75 confirmation threshold |
| 2018 altseason trigger | N/A | Began around 38% BTC.D |
| 2021 altseason trigger | N/A | Began below 45% BTC.D |
This comparison highlights a key structural question for the current cycle: previous altseasons began at meaningfully lower dominance levels than the current 56-58% reading. Several analysts have suggested the trigger threshold itself may need recalibration upward for this cycle.
Why the Stablecoin Question Distorts the Reading
A frequently overlooked technical detail significantly affects how BTC.D should be interpreted: most major platforms, including CoinMarketCap, TradingView, and CoinGecko, include stablecoins in their total crypto market cap calculation by default.
With the stablecoin market (led by USDT and USDC) holding a combined market capitalization above $300 billion, including this in the denominator dilutes Bitcoin’s calculated dominance by an estimated 6-8 percentage points compared with a stablecoin-adjusted reading that excludes them. A dominance reading of 55% on one chart could equivalently read as 60% or higher on a stablecoin-excluded basis, for the exact same underlying market conditions.
The practical lesson: always confirm which methodology a given dominance chart or data source uses before comparing readings across different platforms.
The ETF Effect: Why This Cycle’s Dominance Behaves Differently
Spot Bitcoin ETFs, approved and launched in January 2024, have introduced a structural factor that did not exist during the 2018 or 2021 cycles, and this factor is widely cited as a reason dominance may stay structurally higher through much of 2026.
Spot Bitcoin ETFs have attracted tens of billions of dollars in cumulative net inflows since launch. Critically, this institutional capital enters the crypto market exclusively through Bitcoin, since spot ETFs for most altcoins either do not exist yet or have attracted dramatically smaller inflows. None of this ETF-driven capital rotates into altcoins by its nature.
This explains why analysts increasingly argue that the dominance trigger level historically associated with altseason (the 38-45% range seen in 2018 and 2021) might need to be recalibrated upward for 2026 and beyond.
What a Genuine Rotation Signal Looks Like Beyond BTC.D Alone
Because BTC.D alone can be misleading, experienced traders typically combine it with several additional signals before concluding a genuine rotation is underway.
ETH/BTC strength. It is common for Ethereum and other major large-cap altcoins to outperform Bitcoin before a broader rotation into smaller altcoins develops.
Stablecoin liquidity levels. Since stablecoins represent deployable capital sitting on the sidelines, growth in stablecoin market cap alongside falling dominance can indicate fresh capital is positioned to rotate into altcoins.
Sector-level trading volume. Early rotation phases tend to be selective, concentrated in specific narratives or sectors, such as AI-linked tokens or real-world-asset projects in the current cycle, rather than lifting the entire altcoin market indiscriminately.
Bitcoin’s own price stabilization. A common early signal is Bitcoin’s price movement slowing down or consolidating after a strong run, since capital often begins rotating into altcoins once Bitcoin itself stops providing the best risk-adjusted returns.
Using Dominance as a Regime Filter, Not a Timing Tool
Perhaps the most important practical reframing for traders: BTC.D works best as a regime filter that decides what kind of trades to look for, not as a precise timing signal indicating exactly when to enter or exit a position.
In a clear, sustained dominance uptrend, this favors biasing toward Bitcoin long positions and reducing altcoin position sizing. In a clear, sustained dominance downtrend, the bias shifts toward favoring altcoin longs and reduced Bitcoin-only concentration.
Who Should Track BTC Dominance Closely?
| Trader/Investor Profile | Relevance of BTC.D Tracking |
|---|---|
| Active crypto traders rotating between BTC and altcoins | High. Directly informs portfolio allocation bias and sector rotation timing |
| Long-term Bitcoin-only holders | Lower direct relevance to their own strategy, though useful broader market context |
| Altcoin-focused traders and fund managers | High. Core input for risk-on/risk-off sector positioning decisions |
| Institutional allocators evaluating crypto exposure | Moderate. Useful context for understanding capital flow dynamics within the asset class |
Our Take
BTC dominance remains one of the most widely followed metrics in crypto markets, but its 2026 behavior illustrates why it must be interpreted carefully rather than read as a simple, standalone trigger. Dominance has declined meaningfully from its 2025 peak, yet the Altcoin Season Index has not confirmed a broad rotation, a combination explained by the dual effects of stablecoin-driven calculation distortion and a structurally elevated dominance floor created by sustained spot Bitcoin ETF inflows that did not exist in prior cycles.
For traders seeking genuine rotation signals, the most reliable approach combines BTC.D with ETH/BTC strength, stablecoin liquidity trends, and sector-specific volume patterns, treating dominance as a regime filter that informs broad portfolio bias rather than a precise, standalone timing mechanism for individual trade decisions.
This article is for informational and educational purposes only and does not constitute financial or investment advice. Cryptocurrency investments carry significant risk of loss. Always conduct your own research and consult a qualified financial advisor before making investment decisions.
Frequently Asked Questions
