GARCH Model for Crypto Traders: Understanding Volatility Clustering


- Volatility clustering means large price moves tend to be followed by more large moves, and small moves by more small moves, rather than volatility being random day to day
- The GARCH model captures this pattern mathematically through a conditional variance equation, where today's volatility forecast depends on yesterday's volatility and yesterday's price shock
- Research consistently finds that cryptocurrency markets exhibit stronger volatility clustering than traditional stock markets, with some persistence parameters approaching the theoretical maximum
- Asymmetric GARCH variants, such as EGARCH and TGARCH, capture the "leverage effect," where negative price shocks increase future volatility more than positive shocks of the same size
- Studies comparing GARCH variants for Bitcoin and other major cryptocurrencies have found tGARCH and EGARCH models often outperform the basic standard GARCH model in capturing crypto-specific volatility behavior
- GARCH models assume volatility clustering follows a relatively stable statistical process, which can break down during structural shocks like exchange collapses or major regulatory announcements
- Crypto's 24/7 trading schedule raises a practical modeling question that does not arise in equity markets: whether to use daily, hourly or even higher-frequency data when fitting a GARCH model
The GARCH model (Generalized Autoregressive Conditional Heteroskedasticity) is a statistical tool that captures volatility clustering, the tendency for periods of high price volatility to be followed by more high volatility, and calm periods to be followed by more calm. For crypto traders, GARCH models help forecast how turbulent an asset’s price is likely to be in the near future, based on recent volatility patterns, which supports better position sizing, risk management and options pricing decisions. This guide explains how GARCH works, why crypto markets exhibit unusually strong volatility clustering, and the model variants most relevant to digital assets.
What Is Volatility Clustering?
Volatility clustering describes a well-documented pattern in financial markets: large price changes tend to be followed by other large price changes, of either direction, while small price changes tend to be followed by more small price changes. In other words, volatility itself appears to come in clusters rather than being evenly or randomly distributed across time.
This pattern was first formally identified and modeled in the early 1980s and has since become one of the most consistently observed “stylized facts” of financial return series. Standard statistical models that assume constant variance, such as basic linear regression or simple time series models like ARIMA, cannot adequately capture this behavior, since they assume volatility stays flat over time. This limitation is what motivated the development of GARCH-type models specifically designed to let volatility itself evolve and depend on recent history.
Engle’s ARCH test, a standard statistical diagnostic, is commonly used to formally check whether a given return series exhibits this conditional heteroskedasticity (the technical term for non-constant, time-dependent variance). When applied to cryptocurrency return series, this test consistently produces highly significant results, providing strong statistical evidence that periods of high volatility do indeed cluster together rather than occurring randomly.
How the GARCH Model Works
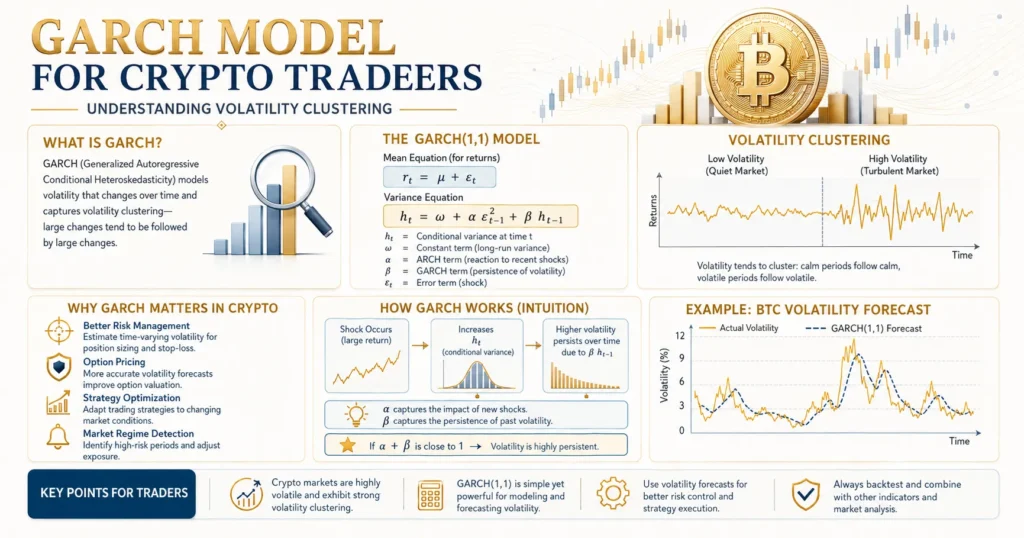
The GARCH model expresses the conditional variance, the model’s forecast of how volatile an asset will be at the next time step, as a function of two components: how large the most recent price shock was, and how volatile the asset has been recently.
The standard GARCH(1,1) specification can be summarized conceptually as:
Conditional Variance (σ²ₜ) = ω + α × (yesterday’s squared shock) + β × (yesterday’s conditional variance)
In this formulation, ω (omega) is a constant baseline level of variance, α (alpha) captures how strongly a recent price shock impacts the next period’s volatility forecast, and β (beta) measures how persistent volatility is, meaning how much of yesterday’s volatility level carries forward into today’s forecast, independent of any new shock.
This structure is what gives GARCH its name: it is autoregressive (today’s variance depends on past variance) and conditionally heteroskedastic (variance is not constant but conditional on recent information). The practical effect is a model that naturally produces clustering: a large shock today raises the variance forecast for tomorrow, which in turn feeds into the forecast for the day after, gradually decaying back toward the baseline level unless another shock arrives.
Research applying GARCH-family models to cryptocurrencies including Bitcoin, Ethereum and Binance Coin has found beta coefficients commonly ranging between approximately 0.91 and 0.99, confirming that volatility carries a substantial long-term component and that market condition changes generate effects that persist well beyond a single trading day.
Why Crypto Volatility Clustering Differs from Traditional Markets
Multiple academic studies and practitioner analyses converge on a consistent finding: cryptocurrency markets exhibit stronger autocorrelation in volatility than traditional stock markets, meaning the clustering effect is more pronounced and longer-lasting in crypto.
When Bitcoin experiences a large daily price move, there is a statistically significantly higher probability of continued elevated volatility compared with the pattern typically observed following a comparably sized move in equity markets. The mathematical basis for this lies in the strength of the conditional heteroskedasticity present in crypto return series; some studies even document persistence parameters approaching unity (a value of 1, representing maximum theoretical persistence), implying that volatility shocks in crypto can take unusually long to fully decay.
| Characteristic | Traditional Stock Markets | Cryptocurrency Markets |
|---|---|---|
| Volatility clustering strength | Present but moderate | Stronger and more persistent |
| Typical clustering duration | Days to weeks | Can extend to months |
| Trading schedule | Fixed market hours, 5 days/week | 24/7, 7 days/week |
| Return distribution | Fat-tailed (leptokurtic), moderately | More heavily fat-tailed and skewed |
| Structural break frequency | Lower | Higher (exchange failures, regulatory shocks) |
This combination of properties, fatter tails, stronger persistence, and a skewed return distribution, is why researchers have increasingly turned to specialized statistical distributions within GARCH models, such as the Normal Inverse Gaussian (NIG) distribution, finding that these adequately capture crypto’s leptokurtic (fat-tailed) and skewed return characteristics better than the standard normal distribution assumption used in many traditional finance applications.
Key GARCH Model Variants for Crypto
Several GARCH variants extend the basic model to capture features specific to crypto’s volatility behavior. Choosing the right variant matters because, as multiple studies note, the optimal model often depends on the specific cryptocurrency being analyzed rather than a single universally best specification.
| Model | Key Feature | Why It Matters for Crypto |
|---|---|---|
| Standard GARCH (sGARCH) | Symmetric response to past shocks | Baseline model; assumes positive and negative shocks affect volatility equally |
| EGARCH (Exponential GARCH) | Captures asymmetric volatility response | Models the leverage effect, where negative shocks raise volatility more than positive ones |
| TGARCH / tGARCH (Threshold GARCH) | Asymmetric shock response via threshold term | Found in multiple studies to be a strong performer for Bitcoin specifically |
| IGARCH (Integrated GARCH) | Assumes shocks persist indefinitely (no mean reversion) | Relevant when volatility persistence appears extremely high, as often observed in crypto |
| CGARCH (Component GARCH) | Separates short-run and long-run variance components | Useful for distinguishing temporary shocks from longer-term volatility regime shifts |
The leverage effect deserves particular attention for crypto traders. Multiple studies confirm that negative shocks (sharp price drops) tend to generate more subsequent volatility than positive shocks (sharp price increases) of the same magnitude. This implies that bad news, sell-offs and crashes typically trigger a larger jump in expected future volatility than comparably sized rallies, a pattern asymmetric models like EGARCH and TGARCH are specifically designed to capture, unlike the standard symmetric GARCH specification.
In direct comparative studies, the tGARCH model combined with a Normal Inverse Gaussian distribution has been identified as a particularly strong performer for Bitcoin, since it captures both the asymmetric response to shocks and the heavy-tailed, skewed nature of crypto returns simultaneously. Other research applying GARCH, EGARCH, TGARCH, APARCH, CGARCH and ACGARCH models across multiple cryptocurrencies found an AR-CGARCH specification performed best in one comparative study, underscoring the importance of testing multiple variants rather than assuming a single model fits all digital assets equally well.
Practical Applications for Crypto Traders
Risk management and position sizing. A GARCH-based volatility forecast can inform how much capital to risk on a given position. When the model forecasts elevated near-term volatility, reducing position size or widening stop-loss distances can help align risk exposure with the asset’s current statistical behavior rather than its long-run average volatility.
Options and derivatives pricing. Crypto options pricing models depend heavily on volatility inputs. A GARCH forecast that accounts for current clustering conditions, rather than relying on a flat historical average, generally produces more responsive and accurate implied volatility estimates.
Value-at-Risk (VaR) estimation. Extensions of GARCH, including regime-switching variants such as Markov-switching GARCH (MSGARCH), have been shown in academic research to outperform single-regime GARCH specifications specifically in VaR forecasting, since they can adapt to discrete shifts in the underlying volatility regime rather than assuming one continuous process throughout.
Volatility-adjusted strategy filters. Some trading approaches use a GARCH-based or simpler ATR-based volatility estimate as a filter, only taking trade signals when forecasted volatility falls within an acceptable range, avoiding both abnormally quiet, low-opportunity conditions and excessively chaotic, high-slippage conditions.
Limitations and Practical Challenges
GARCH models assume that the underlying volatility-generating process is relatively stable over the estimation period, an assumption that cryptocurrency markets can violate more frequently than traditional markets. During major structural events, such as a large exchange collapse or a significant regulatory announcement, the underlying volatility process can shift abruptly, and GARCH forecasts can perform poorly until the model has enough new data to adapt to the changed environment.
Sampling frequency presents a crypto-specific modeling decision. Daily data is the standard convention for equity GARCH models, reflecting fixed market hours. Crypto’s continuous 24/7 trading raises a genuine question about whether higher-frequency data, such as hourly observations, might capture volatility dynamics more accurately. However, very high-frequency data also introduces additional noise and computational complexity, meaning the choice of sampling frequency itself requires careful consideration rather than a default assumption.
Calendar effects have also been documented in crypto markets, with some studies finding that returns and volatility show patterns tied to specific days or periods, adding another layer of complexity beyond the basic clustering pattern that GARCH captures.
Finally, GARCH models are statistical forecasting tools describing the likely magnitude of future price movement. They do not predict price direction, and a volatility forecast should not be interpreted as a directional trading signal on its own.
Who Should Use GARCH Modeling?
| Trader/Investor Profile | Relevance of GARCH Modeling |
|---|---|
| Quantitative and systematic crypto traders | High. Directly applicable to position sizing, risk limits and strategy filters |
| Options and derivatives traders | High. Volatility forecasting is a core input to pricing models |
| Discretionary swing or position traders | Moderate. Useful as a risk-awareness tool, less critical than for systematic strategies |
| Long-term buy-and-hold investors | Lower. Short-term volatility forecasting has limited relevance to multi-year holding strategies |
| Risk managers at trading desks or funds | High. Core component of VaR estimation and portfolio risk frameworks |
Our Take
Volatility clustering is one of the most consistently observed patterns in cryptocurrency markets, and it tends to be stronger and more persistent than in traditional equities. GARCH models provide a mathematically grounded way to forecast this clustering behavior, with asymmetric variants like EGARCH and TGARCH proving particularly valuable for capturing crypto’s tendency toward sharper volatility spikes following negative price shocks.
For crypto traders, the practical value lies less in predicting price direction and more in better anticipating how turbulent conditions are likely to be in the near term, supporting more disciplined position sizing, risk management and derivatives pricing decisions. As with any statistical model, GARCH forecasts should be treated as one input among several, particularly given crypto’s susceptibility to sudden structural shocks that can temporarily undermine even well-fitted models.
This article is for informational and educational purposes only and does not constitute financial or trading advice. Quantitative models such as GARCH carry inherent limitations and should not be relied upon as a sole basis for trading decisions.
Frequently Asked Questions
